Athens Stock Exchange,
on one platform.
An analytics platform made by investors, for investors. Compare the whole Athens Stock Exchange side by side, track your holdings transaction by transaction, and get told when a number moves.
Free to sign up. Available in Greek and English.
Stop opening a page per company.
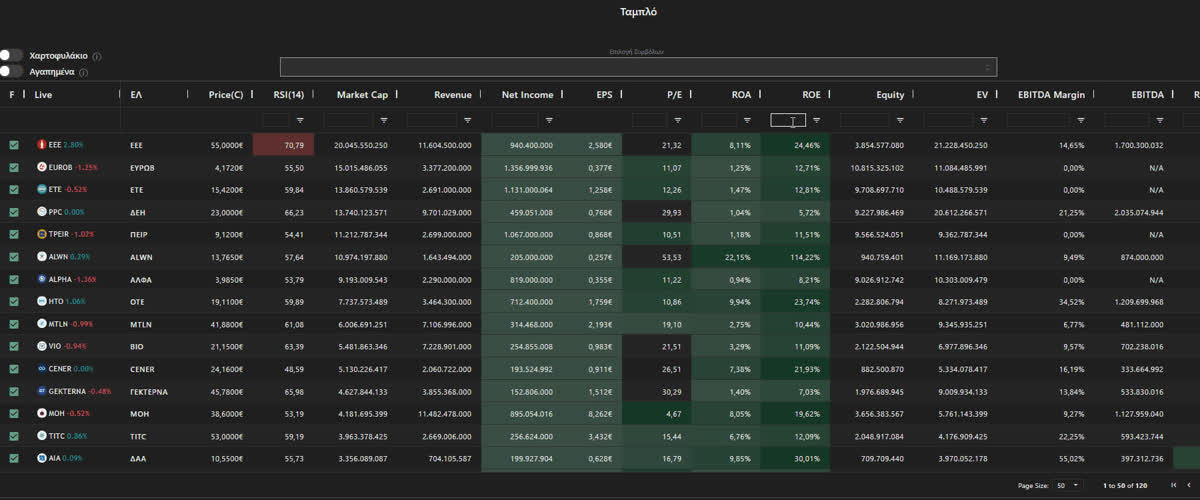
The Central Dashboard is an Excel-like view of the whole exchange. Select, filter and sort every listing by any metric, with colour scales built per metric so the outliers find you rather than the other way round.
- One surfaceEvery company and every metric in a single table
- Any metricSort and filter on whichever column you're actually using
- Colour scalesBuilt per metric, matched to how that number behaves
- Narrow it downLimit the view to your holdings or your favourites
- Live pricesPrice and daily change refresh every minute, with an intraday chart per symbol
- Ready-made viewsColumn sets for Valuation, Profitability, Growth and Health, plus full screen
Your portfolio, transaction by transaction.
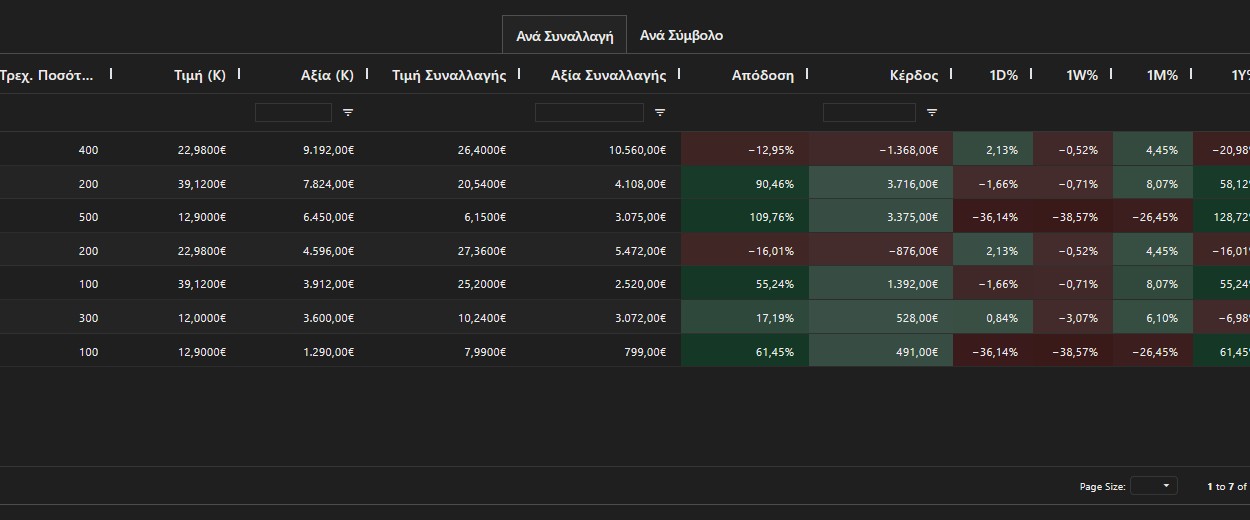
Most tools flatten a holding into one average cost. This one keeps every purchase separate, so you can see which specific decisions are carrying a position and which are dragging on it.
- Per positionEach buy tracked on its own, or rolled up per symbol
- AllocationA distribution chart showing how concentrated you are
- Value over timeValued at current prices, with a value chart and a table of the last 10 days
- SalesLIFO by default, or pick the exact lots a sale draws from
- ExportSend the whole portfolio or transaction log to a file
Set a number. Get told when it's reached.
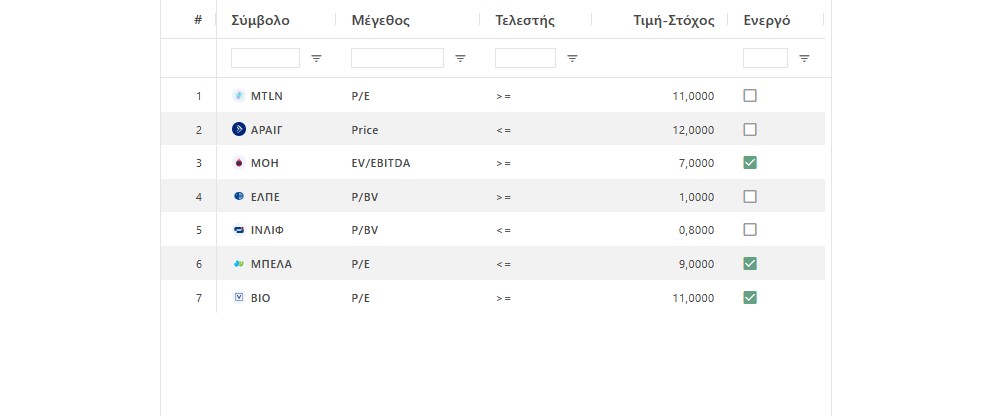
Alerts aren't limited to price: they also cover the core fundamentals in the Central Dashboard. Pick a company, pick a metric, set your target, and go do something else — you'll hear about it by email or Telegram.
- Not just pricePrice, P/E, P/BV, EV/EBITDA, ROE, dividend yield and other fundamentals
- Two channelsEmail or Telegram, whichever you'll actually read
- SwitchableKeep alerts on the shelf and re-arm them when they matter
- SettingsChoose which channel each kind of notification uses
See your own decisions on the price.
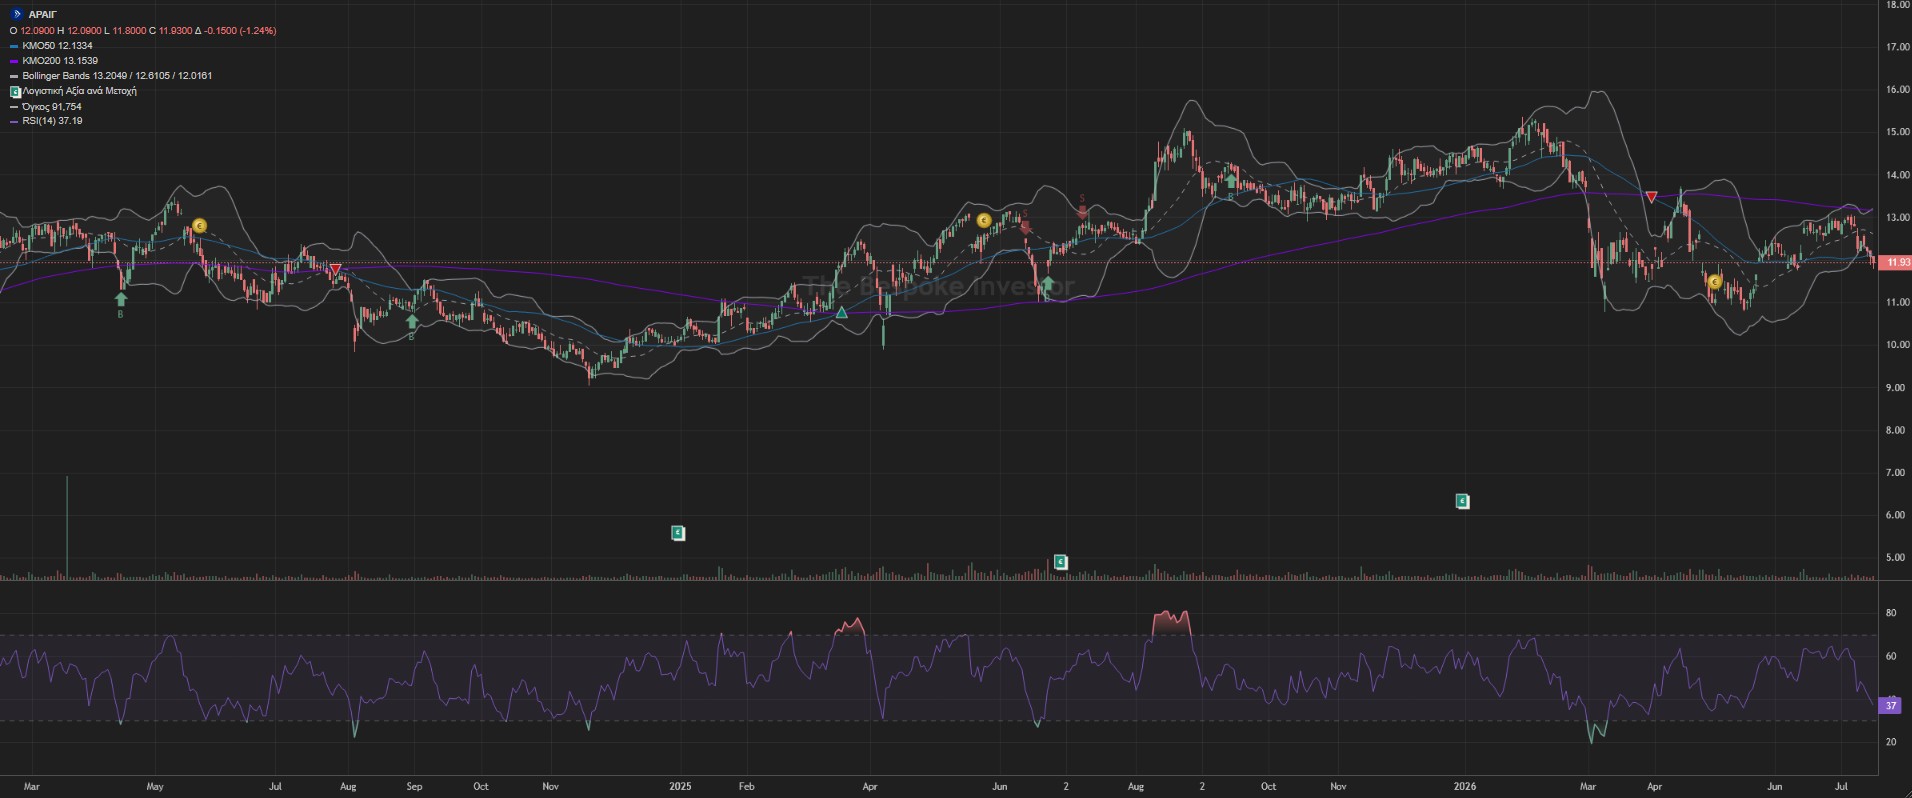
The charts draw your buys, sells and dividends directly onto the price history, alongside moving averages, Bollinger bands, book value per share and market events we've flagged as significant.
- Your movesBuys and sells marked at the price you actually got
- DividendsEvery payment marked on the timeline it was paid
- OverlaysMoving averages, Bollinger, RSI, MACD, Stochastic, ADX, Ichimoku, Parabolic SAR, OBV, A/D and Fibonacci
- CrossesGolden and death crosses marked on the price
- Two viewsPrice or percentage performance, with PNG export of the chart
And the charts you already know.
Full TradingView charts are built in for any ATHEX stock, so the indicators and drawing tools you're used to are one tab away rather than in another browser window.
- Every listingAny ATHEX symbol, in the same interface
- Familiar toolsThe indicators and drawings you already use
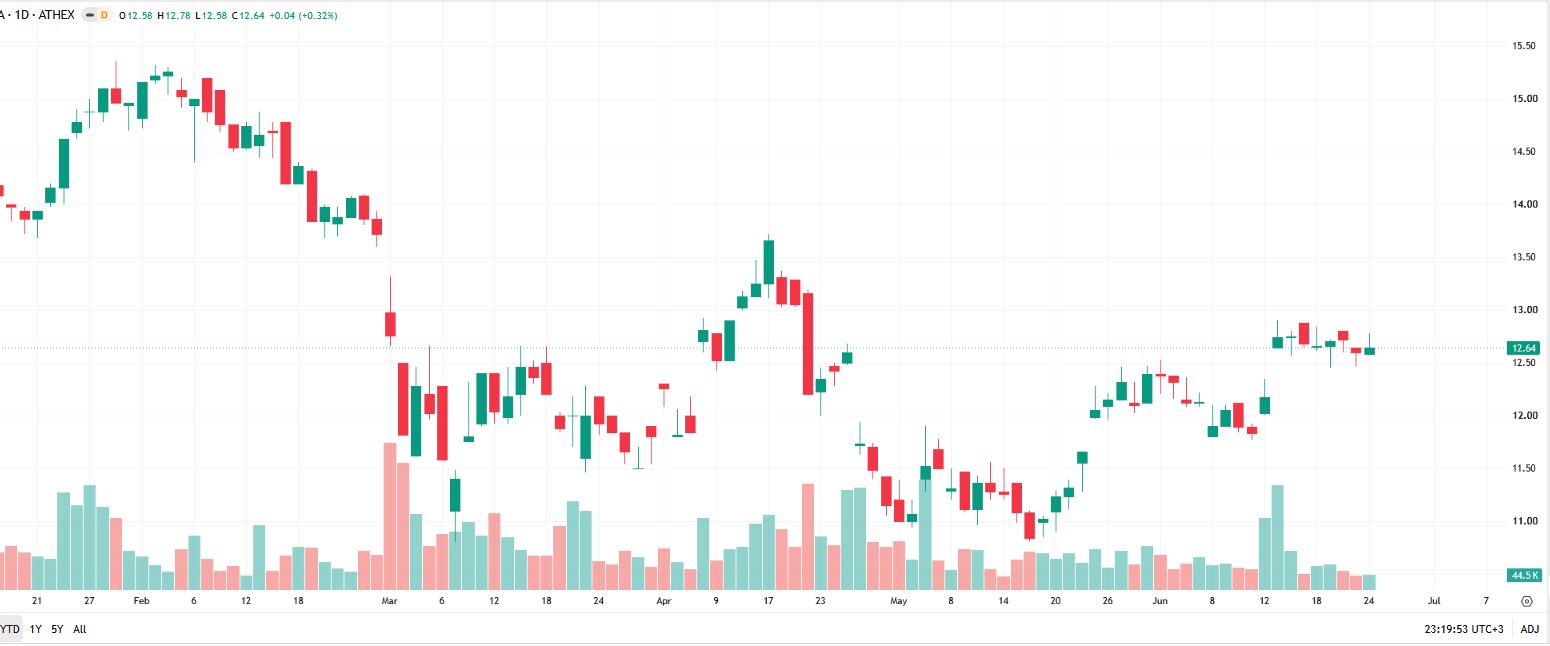
News and filings, attached to the ticker.
Press coverage and official Euronext announcements gathered for the stocks you hold or follow, each item sitting next to the company it concerns and how that company moved on the day.
- Both sourcesFinancial press and official exchange announcements together
- Your listFiltered to your holdings and favourites
- NotifiedOptional notifications for new announcements on your holdings or favourites
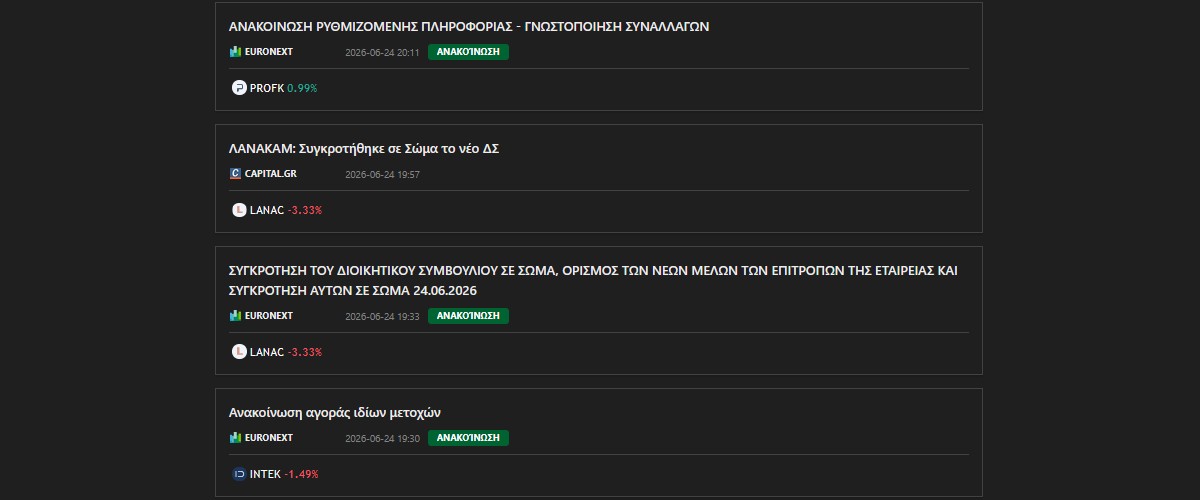
Momentum across the whole board.
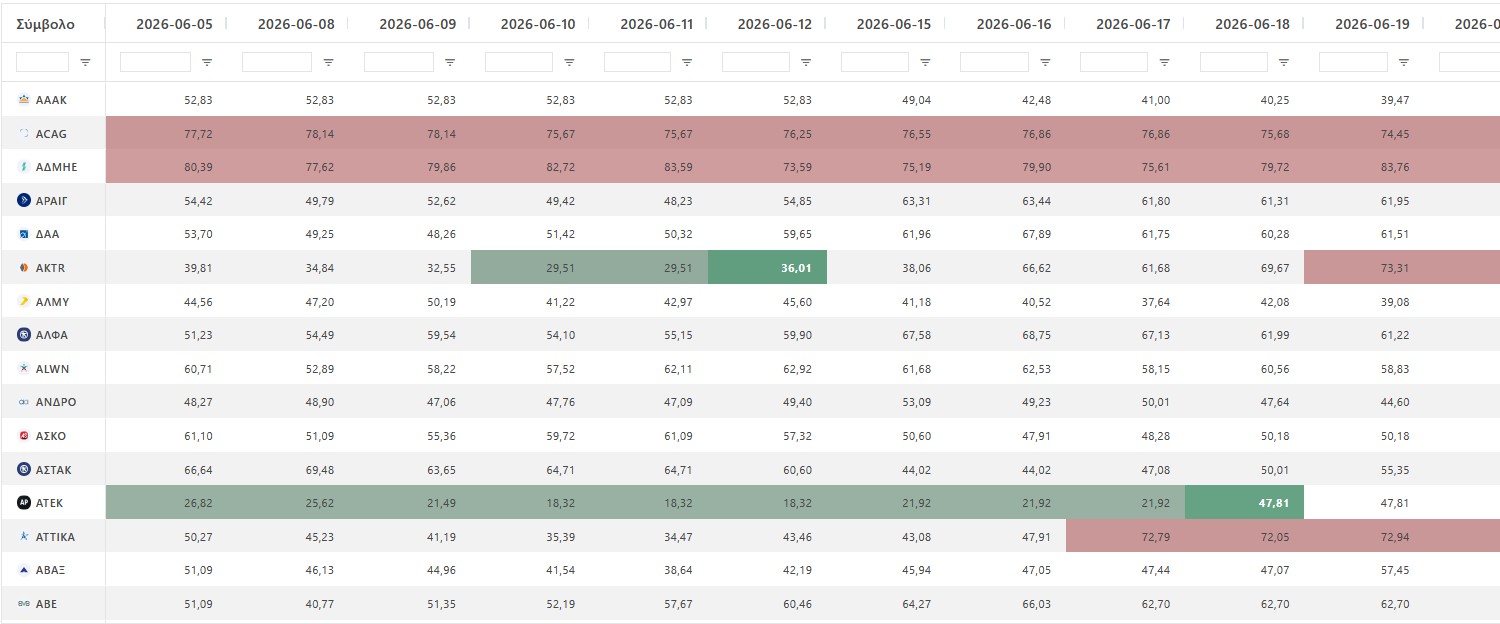
RSI(14) for every ticker over the last fourteen sessions, laid out as one grid. Overbought and oversold conditions show up as bands of colour rather than something you have to check symbol by symbol.
- Whole marketEvery ticker, not just the ones you already watch
- Fourteen daysThe recent trend, not a single day's reading
And the rest of the workbench.
Everything below is already in the app. Nothing here is a roadmap item.
Start with a company you already own.
Open the dashboard, find your ticker, and see whether the numbers agree with the reason you bought it.